
Reporting
Build dashboards for your workspaces, with charts, numbers, card lists and more
In this article
Dashboards show the numbers of your work: how many cards are late, who has too much work, how fast the team goes… They update with the data of your workspace.
Introduction
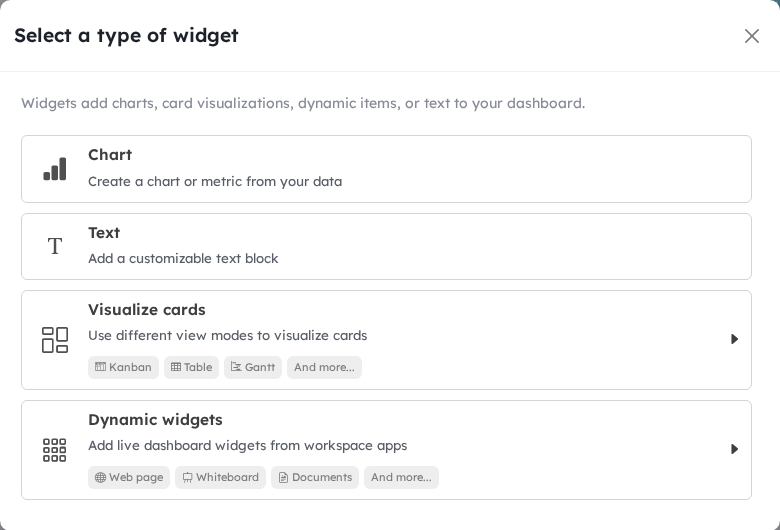
A dashboard is a view of the workspace, made of widgets:
- Chart: a chart or a number, computed from your cards.
- Text: a text block, for example a title or an explanation.
- Visualize cards: a small view of cards (kanban, table, Gantt…), with its own filter.
- Dynamic widgets: a document, a whiteboard, a web page, the journal or the logs of the workspace.
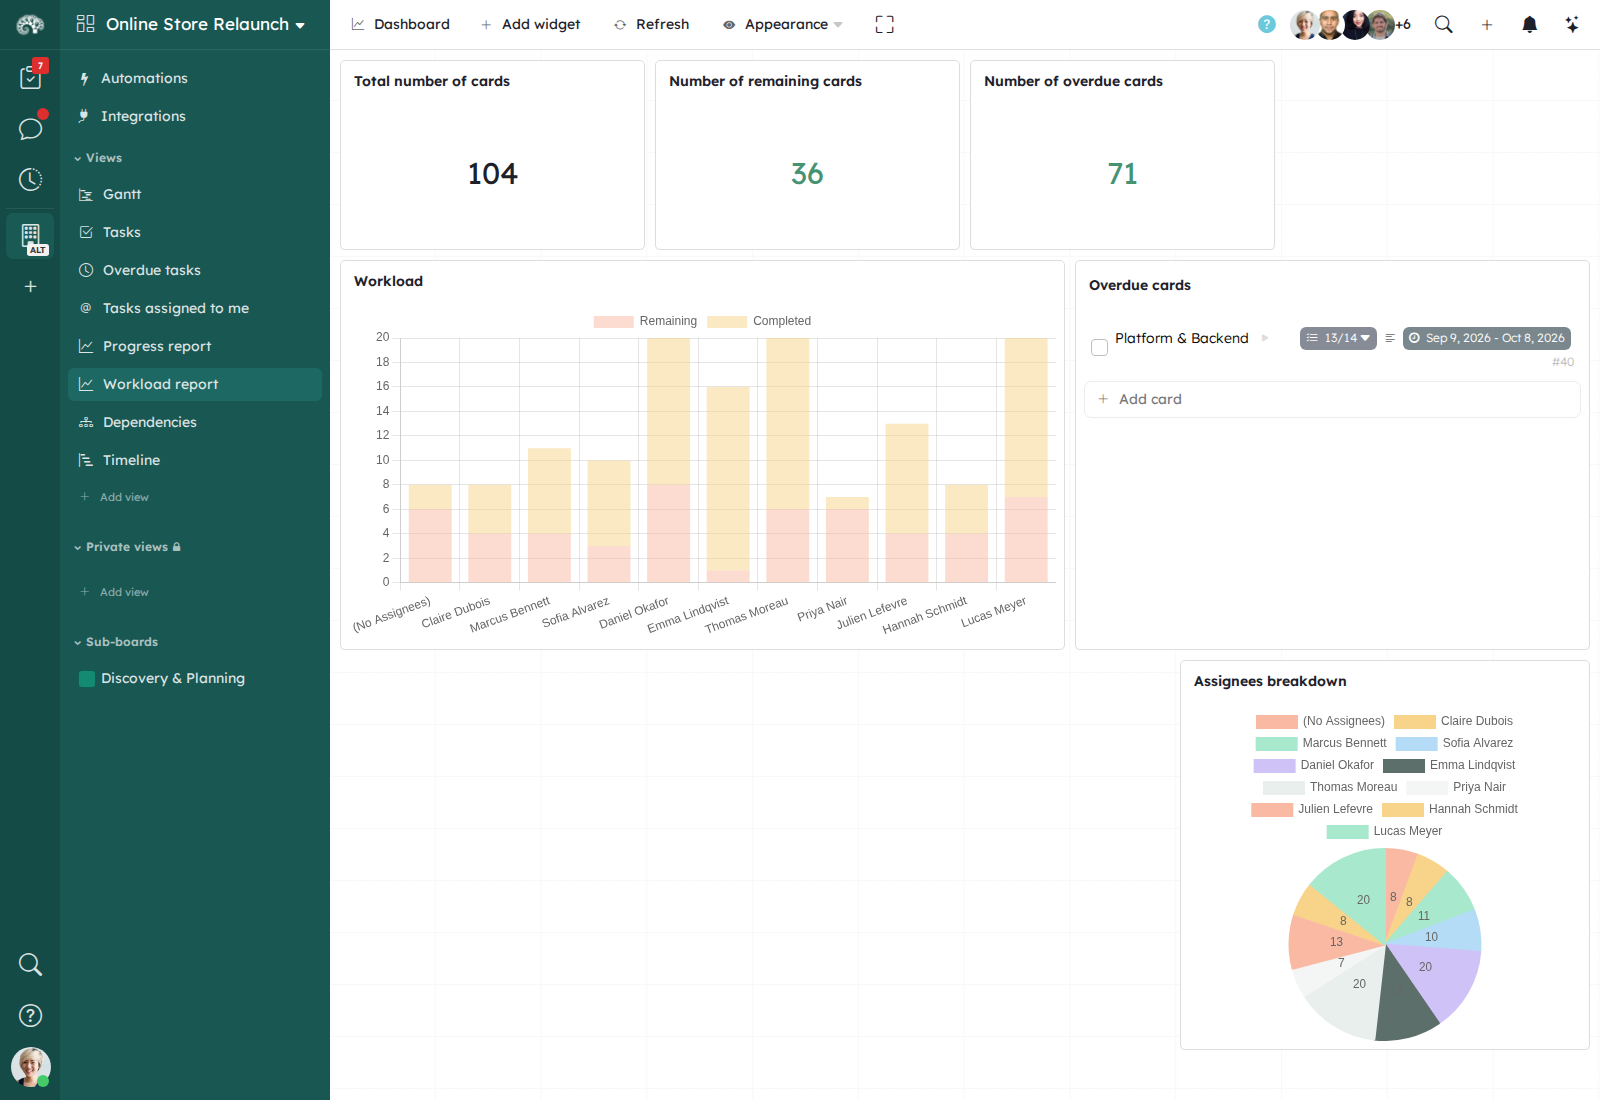
Some templates come with a ready-made dashboard, for example Progress report. You can also start from an empty dashboard.
Create a dashboard
In a workspace, to follow one project: click Add view, then Dashboard.
In My work, to follow several workspaces: click Add dashboard in the Dashboards section of the sidebar. Each chart then lets you choose the workspaces to use (Select workspaces).
Add widgets
- Click Add widget in the toolbar.
- Choose the type of widget.
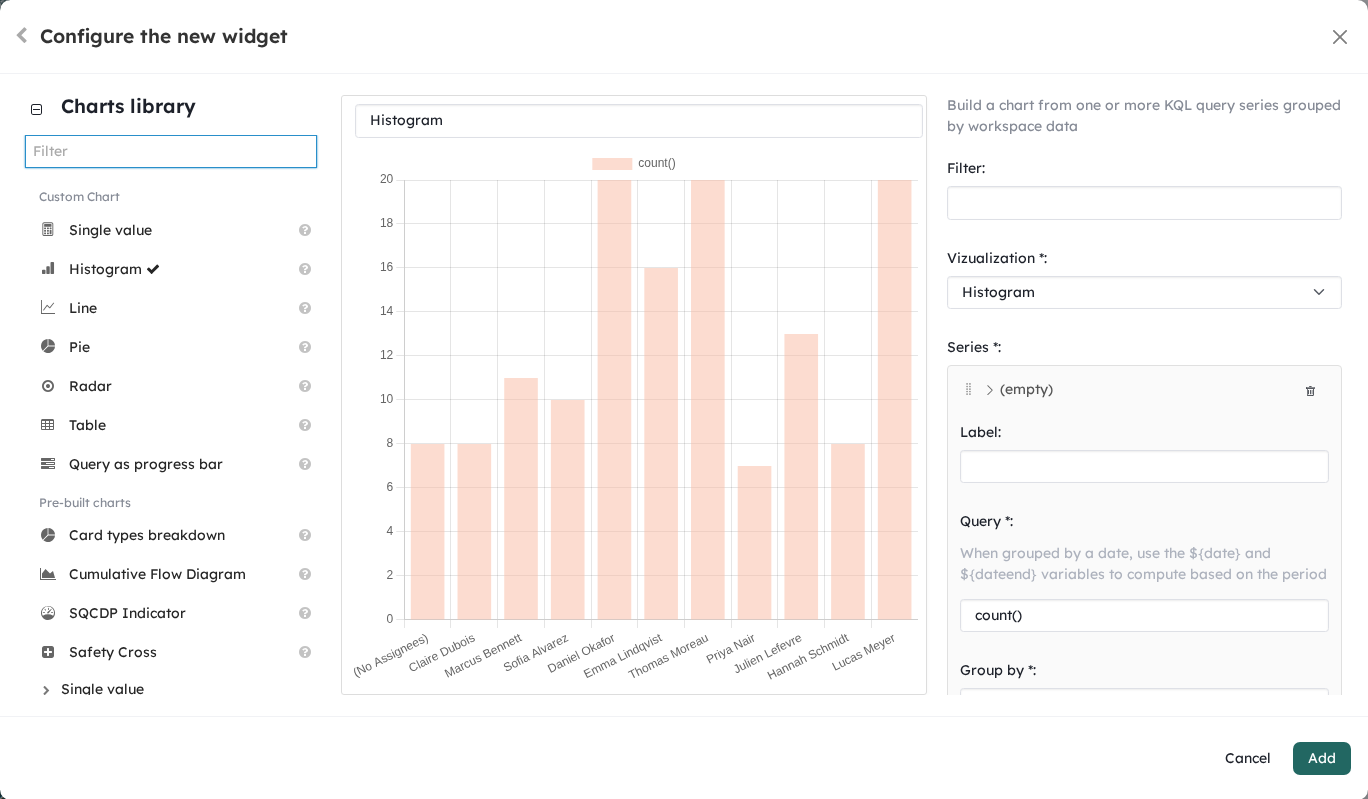
For a Chart, choose the chart in the Charts library on the left. The middle shows a preview, and the right gives the options of the chart. Give the chart a title, then click Add.
Hover a widget to see its buttons: the settings of the widget, full screen, and the trash to remove it. Click the title of a widget to rename it.
Widgets show the data at the time the dashboard loads. Click Refresh in the toolbar to update them.
Organize the dashboard
- To move a widget, drag it by its title.
- To resize a widget, drag its bottom right corner.
Save the dashboard
Like for the other views, your changes are only for you until you save them. Click the star next to the dashboard in the sidebar, then overwrite the view or save a new view. See Save a view.
For a ready-made dashboard, Regenerate in the Appearance menu builds it again from the current fields of the workspace.
Share a dashboard like the other views, and add it to My work with Add to my work in the menu of the view.
The charts
The Charts library has two parts:
- Custom Chart: charts that you build with your own queries. See Custom charts.
- Pre-built charts: charts for common needs, sorted by topic.
Card types breakdown
A pie chart of the cards by card type. Archived cards are not counted.
Cumulative Flow Diagram
The number of cards in each group over time. Each band is a group, for example “Todo”, “Doing” and “Done”. A band that grows shows a bottleneck in your workflow.
Options: the group field (for example State), the period, and whether to include the archived cards.
Burndown chart
The burndown chart comes from the Scrum method. It shows how many points of work remain in a sprint, and forecasts its end: you see if the team is ahead or late.
There are two burndown charts:
- Burndown Chart (using groups): the sprints are the groups of a field, for example a Milestone field with dates. Choose the sprint to show, or let Kantree use the current one.
- Burndown Chart (via relationships): the sprints are cards, linked to the tasks by a relationship field. Choose the date field that gives the dates of the sprint.
Points field: a number field with the points of each card (for example story points). Without it, each card counts for the Default number of points.
Archived cards are not counted. Keep it in mind for old sprints.
Groups
These charts use the groups of a field (State, Labels…).
Groups
The number of open and finished cards in each group.
Cards per groups
A pie chart of the cards by group.
Time between groups
A table of the average time that cards take to go from one group (rows) to another (columns). For example: the cards took 4 days on average to go from “Doing” to “Done”.
Time between two groups
The average time that cards take to go from a group A to a group B, over a period.
Evolution of time between two groups
The same time, as it changes over time.
Evolution of number of cards in group
The number of cards in one group over time.
Workload
Workload
The cards of each member: the Remaining cards and the Completed cards. To weight the cards with a number field, use Ponderate. Use this chart to balance the work in the team.
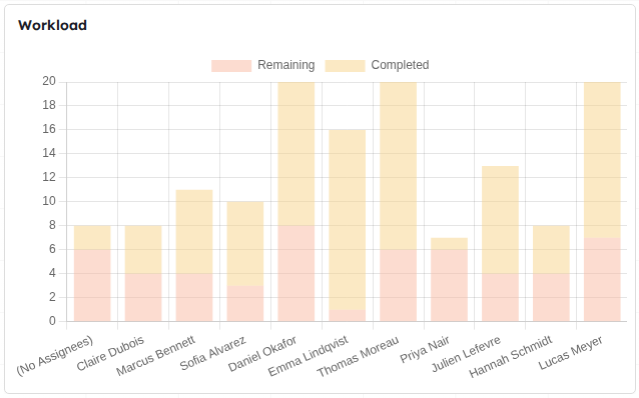
Completed cards are the cards in the Completed or Closed state.
Assignees breakdown
A pie chart of the cards by assignee.
Historic tasks completion per user
The cards completed by each member over time.
Velocity
Velocity is the amount of work that the team finishes in a period. All these charts can count points instead of cards (Points field) and leave out the archived cards (Exclude archived cards).
Velocity
The cards finished in each period (day, week or month), and the average velocity.
Velocity per group
The velocity of each group, for example of each sprint. Velocity Per Sprint (using relationships) does the same when the sprints are cards.
Members velocity
A table of the velocity of each member: completed cards, average completion time, average velocity.
Other pre-built charts
- SQCDP Indicator and Safety Cross: visual indicators used in lean management, computed from a KQL formula.
- Logs: charts of the logs of the cards. See Logs.
Custom charts
Custom charts compute values with your own queries, in KQL, the query language of Kantree. See the KQL guide.
- Single value: one number, for example the number of late cards.
- Filter: which cards to count, for example
{Due Date} < today and state != done. - Computation: Count, Sum, Average, Minimum, Maximum, or KQL Formula for your own formula.
- Field: the number field to compute (for sums, averages…).
- Filter: which cards to count, for example
- Histogram, Line, Pie, Radar: a chart made of one or several series. Each series has a Query (for example
count()) and a Group by: a field, or dates. When you group by dates, choose the Time resolution (day, week, month). - Table: a table with one row for each group, and one column for each computation.
- Query as progress bar: a percentage on a progress bar, for example the share of completed cards.
Click a value of a chart to see the cards that it counts.
Examples
- The cards that are not completed: filter
state != done, computation Count. - The late cards: filter
{Due Date} < today and state != done. - Several values in one table: separate the queries with
;, and give each one a label withas:
query(@me, count()) as "My cards"; query(not @me, count()) as "Other cards"
- The sum of the points of the cards archived since January. Archived cards are not counted by default, so ask for them in the filter:
query({archived}=true and {archived at}>="2026-01-01", sum({Points}))
Query as a progress bar
Shows a query() as a percentage, for example the share of the requests that are completed.
Card widgets
A Visualize cards widget shows cards in the dashboard, with its own view mode and filter. For example: the late cards, the cards assigned to you, the cards of a state, or any KQL filter.
Choose the view mode (Kanban, Table, Gantt…), then set the filter in the settings of the widget.
Logs
The log charts show the logs of the cards: Number of logs per day, Daily sum of number fields, Sum of number fields and Sum of number fields by user. Choose the type of log (Category) and the Period.