Building a universal work management platform
This new release is a major step towards our vision of a tool which helps businesses of all sizes manage tasks, projects, processes and more on a single platorm.
More than ever, Kantree can be used for everything related to project management, roadmapping, HR management, time tracking and so on.
A revamped project navigation
As we are adding new features, we had to rethink the top navigation bar in projects. The previous “visualization mode” dropdown was not meant to navigate to views which didn’t contain cards. As a result, it was hard to understand and limiting for us.

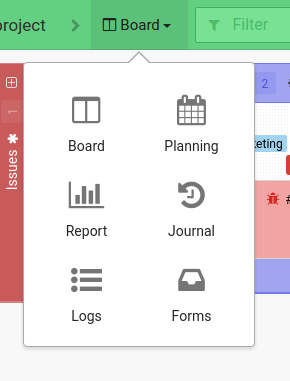
The new layout adds a new menu to switch between different sections of the project:
-
Board (Kanban and Table view) where you can manage cards
-
Planning (Calendar and the new Timeline) to help you meet deadlines and plan for the future
-
Reports, a rebuilt experience which lets you build reporting dashboards for your project
-
Journal to browse all past activities across your project (useful for the daily morning meeting)
-
the new Logs view that helps you track working time and budget information across your project (more on this below)
-
Forms which lets you create forms to collect information from external contributors and automatically create a card.
The group by menu is now at the end of the filter bar.
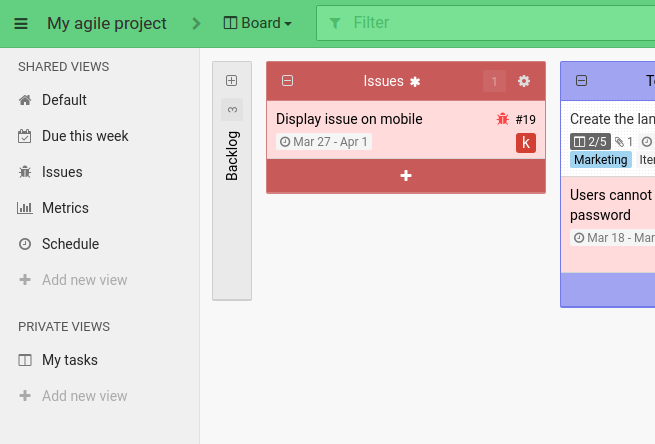
We see the views as an essential way to customize your project but the way to manage them was underwhelming! The most important change is that the sidebar is now expandable using the double arrow button at the bottom. You can now re-order views and update them. We also made the distinction between public and private views more obvious.
Introducing the timeline for easier scheduling
For those of you who prefer to manage their project using a schedule-based approach we’ve added a timeline view, so that managing your schedule becomes more visual. We’ve also refreshed the calendar view. Both of these views are located under the “Planning” section.
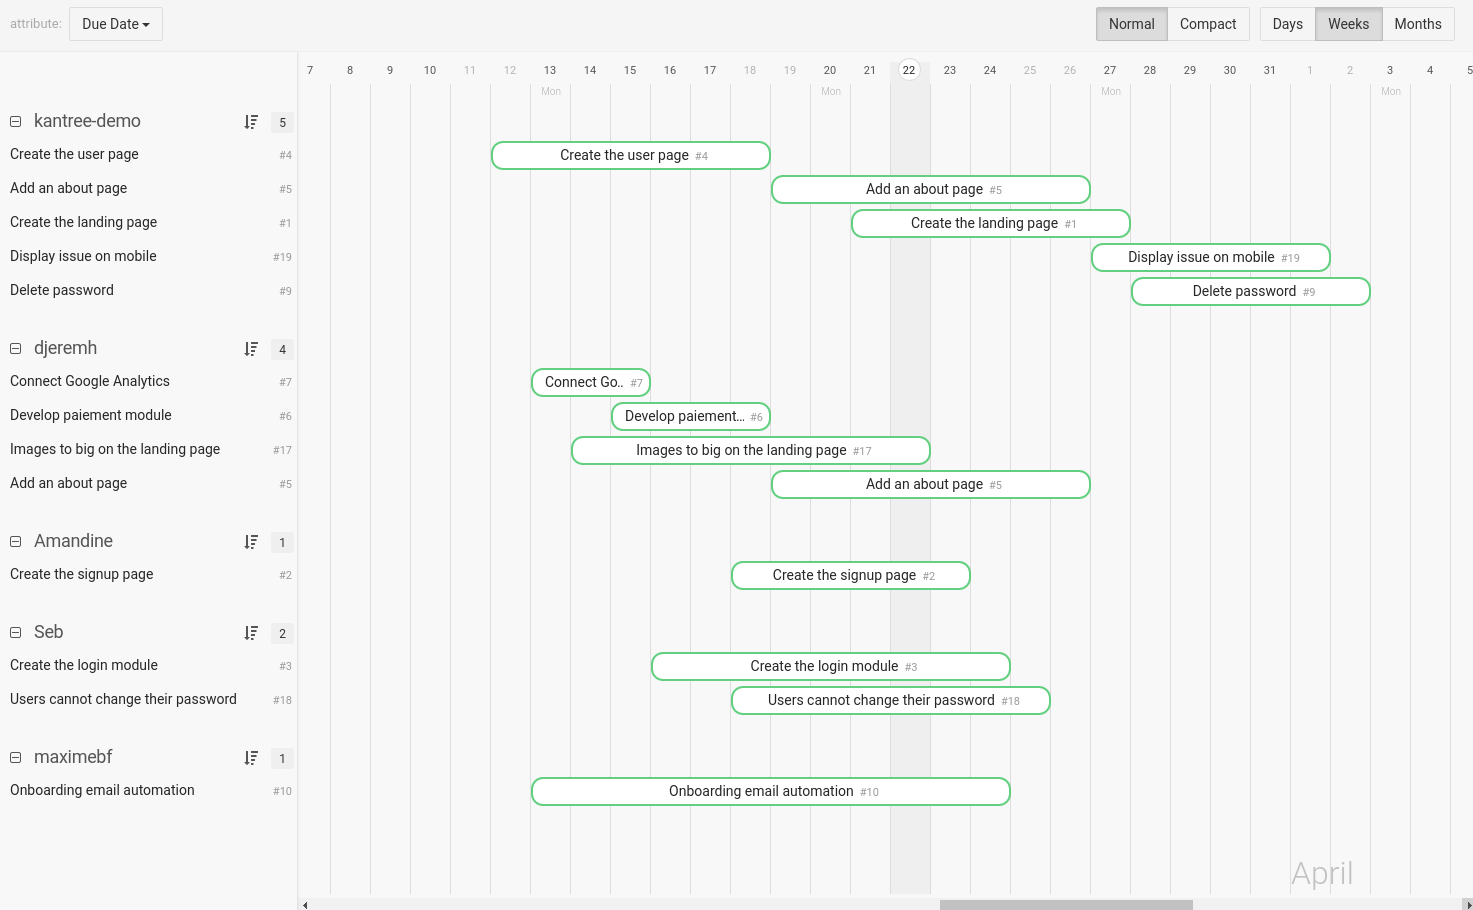
Another important change which was needed to enable the timeline view is the possibility to set date ranges in date attributes.
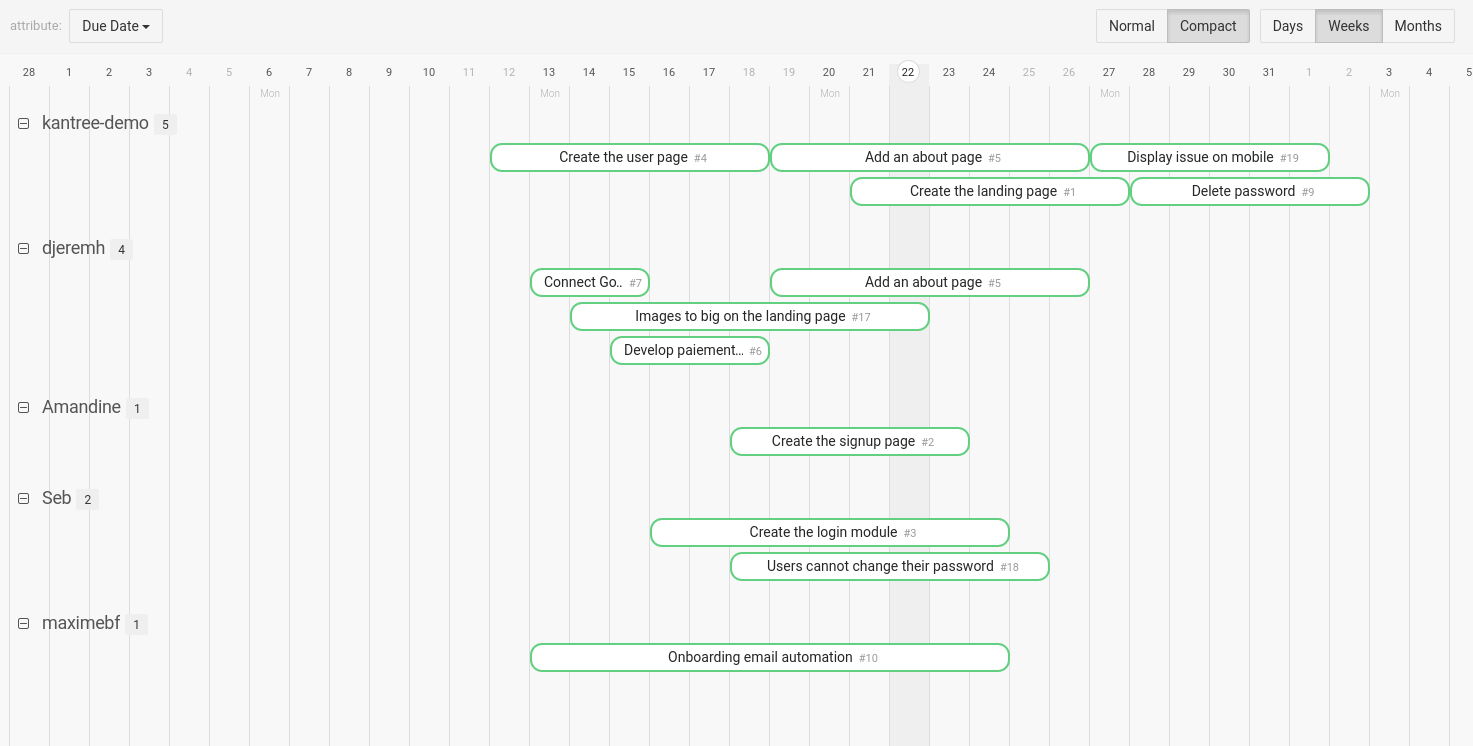
Our timeline view will remind you of a Gantt chart. All cards are visible and you can group them like on in Kanban or Table view. We’ve provided a compact mode which groups your cards in a smart way so that you can effectively see how much cards are running concurrently.
For example, group your cards by assignees and see who is doing what and for how long, and if someone is overloaded with work and how you can fix this.
We can’t wait to have your feedback on this and on how it can help you meet your deadlines more easily.
Create beautiful dashboards with our rebuilt analytics view
Previously, our analytics view was very limited and almost unusable in complex projects. This new Reports view is a complete rebuilt to fix that and give us a strong foundation to expand reporting even further.
Create dashboards by adding charts, list of cards or queries (see further) to it:

Resize and reorganize the widgets, and save your report in your sidebar to quickly access it later. Using shared or private views it is easy to build reports just for you or for the whole team.
We’ve reworked all the charts to be easier to read and configure, you will find workload, cumulative flow diagrams, cycle times, breakdowns, burndown charts… You can also add results of any KQL queries (see further).
Once configured with your project metrics, these reports can help you track your project health and improve the way you work.
Introducing card logs, logging time and expenses is now easier than ever.
With this release we are introducing the ability to log any kind of structured information on a card. The most obvious application of this feature is time tracking.
As always, our approach when adding features is understanding the underlying concepts and then provide a new brick on top of which you can implement your solution to your problem.
We realized that time tracking is the act of logging a structured piece of information (eg.: number of hours worked + description in the case of time tracking) anchored to a precise date and time. This concept is shared by many other type of information tracking. For example:
- track expenses (amount + reason)
- track client calls (number of minutes on the phone + description)
- track physical interventions (travel time + time on site + reason)
- and more…
This new feature let you create different category of information, each of them with their own list of attributes.
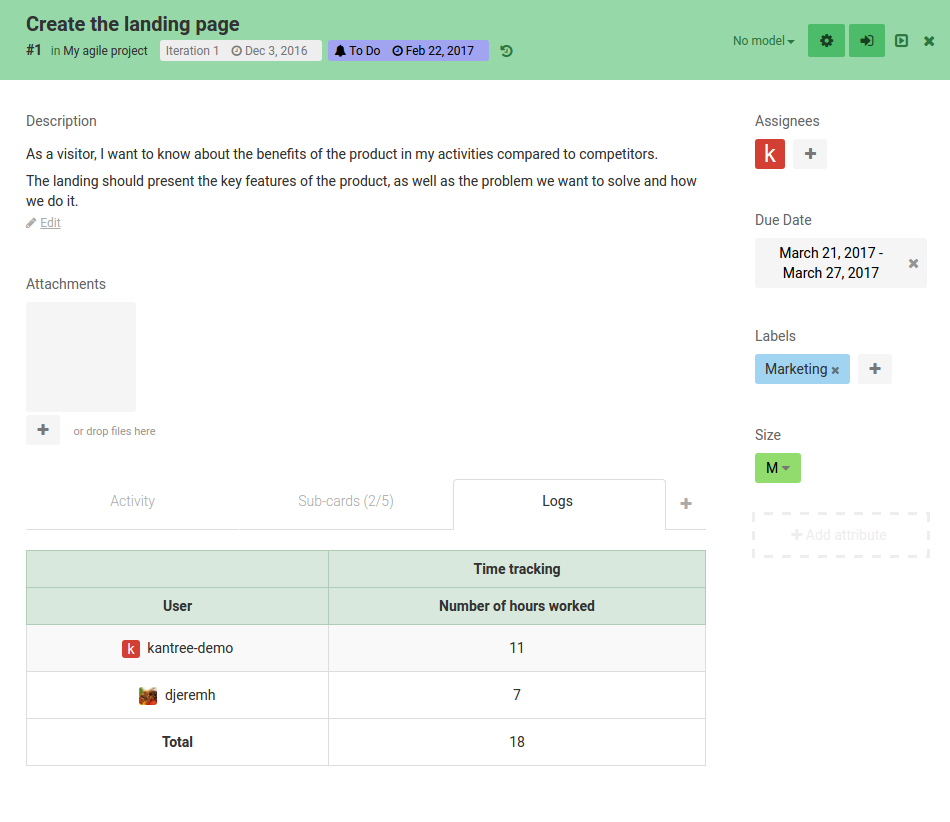
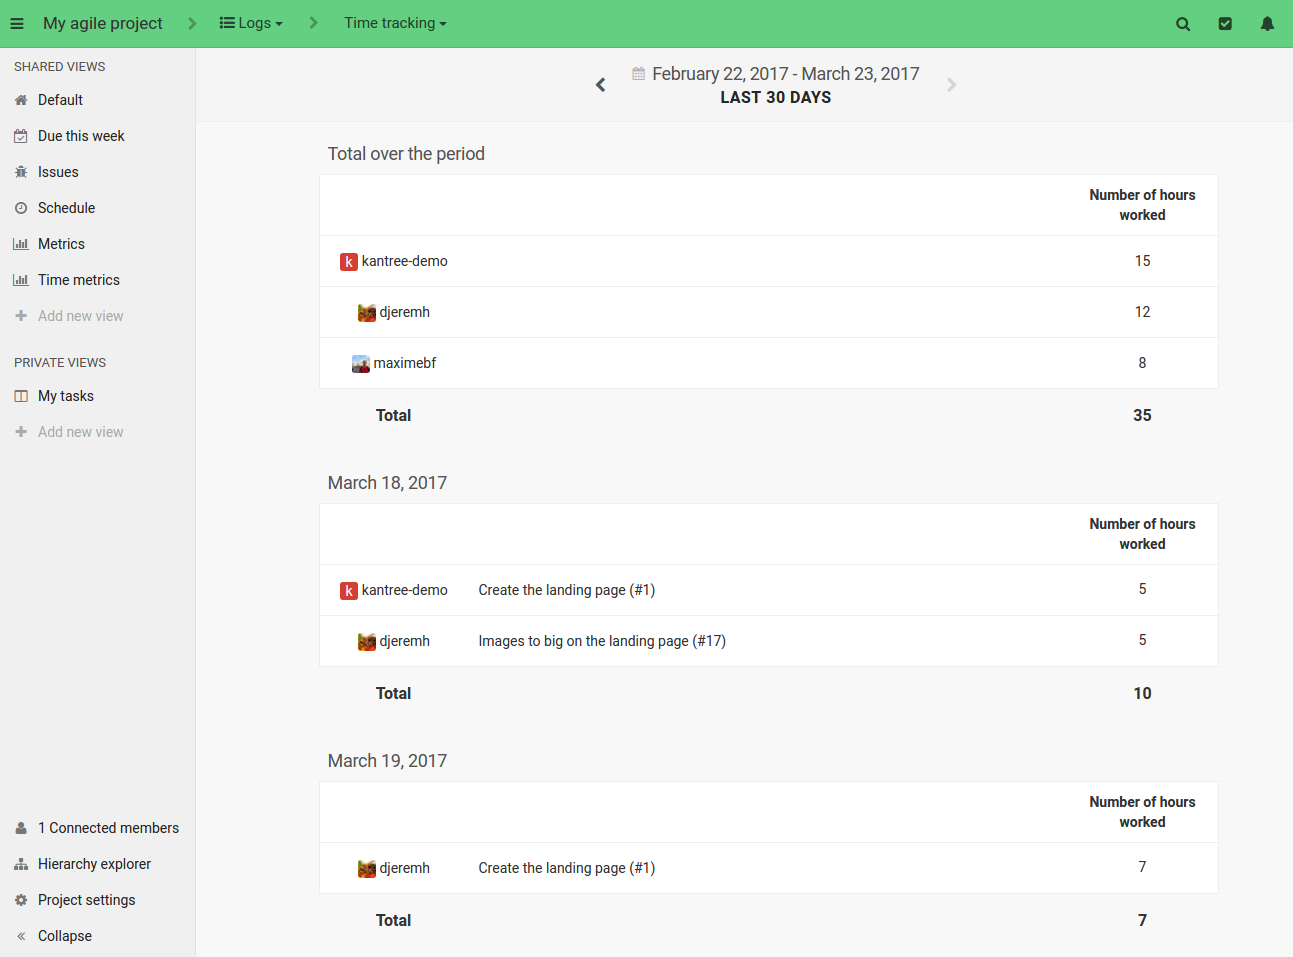
You can then navigate to the logs section and have an overview of logs across all cards (as well as export them to CSV):
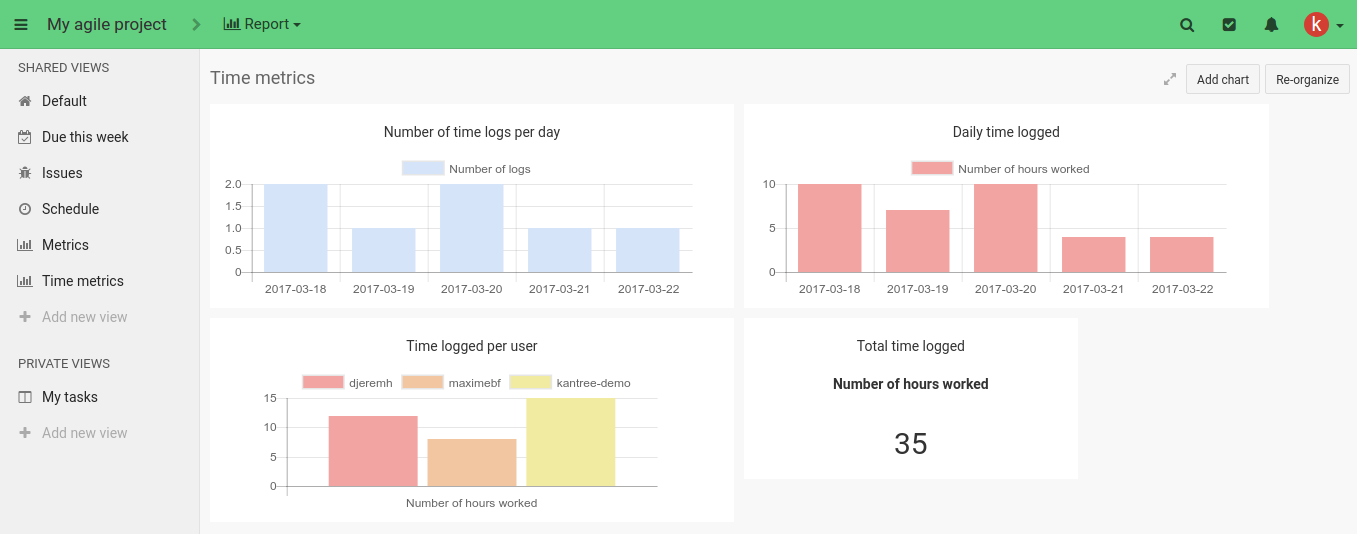
You can also get some information out of logs in your reports:
Introducting a new query language
At the heart of this new release lies a powerful new query language, named KQL for Kantree Query Language. It is the cement between all our building blocks which will allow you to extract information from your project. You can compare it to formulas in Excel.
The full documentation is available in our guides but we’ve also provided a visual query builder for the simple and usefull queries you shoud need right away.
KQL is replacing our old and lacking query language in the project filter bar. (all previous queries saved in views have been migrated).
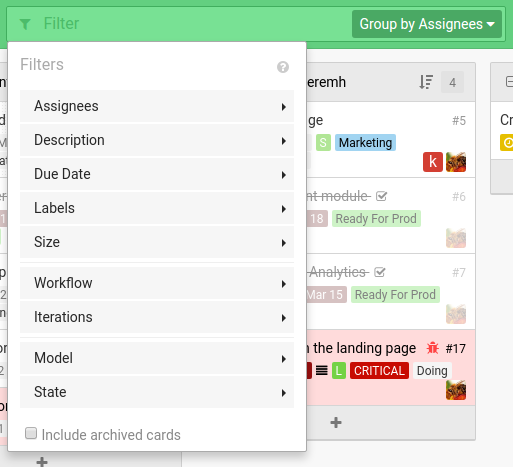
KQL will become more important as time goes. We will soon introduce a proper formula field and query based charts in reports.
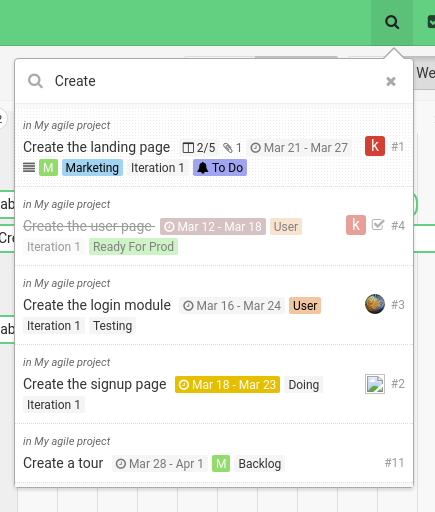
Search across all your projects
Search across all your projects (using KQL) by clicking on the search icon in the top right corner:
A new dashboard more useful for you
The new dashboard now focuses on what’s important for you. Create sections which shows the cards that matters to you using a KQL query:
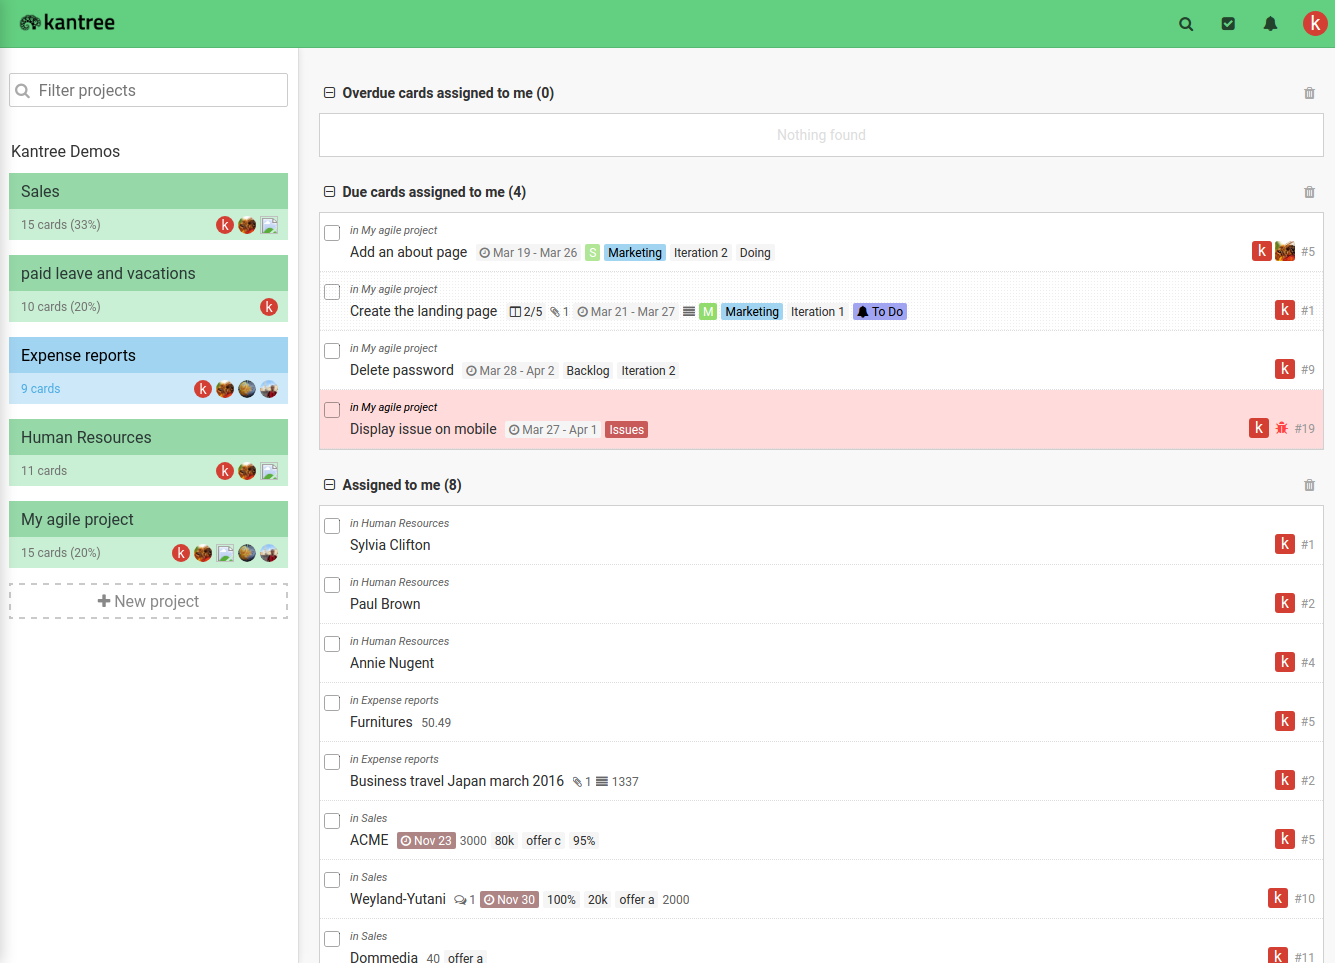
This new dashboard is a first step towards our vision of a place dedicated to your work across all your projects.
Like mentioned in the introduction, our focus this year is to provide businesses with a truly customizable and easy to use work & project management platform.
This release is adding a lot of new stuff towards this goal to help you manage your projects the way you want it. No need to fallback on post-its or excel sheets to do what your project management tool cannot!