How to Create a Gantt Chart in 30 Minutes [Expert Guide 2025]

Invented in 1910 by Henry Gantt, the Gantt chart has become an essential project management tool, used by 86% of business leaders to visualize their plans. This guide will show you how to create an effective Gantt chart in just 30 minutes using Kantree, whether you’re in events, software development, marketing, or construction.
In this article:
- What is a Gantt chart?
- Preparing your Gantt chart
- Steps to create a Gantt chart
- Customizing your Gantt chart
- Finalizing the Gantt chart
- Conclusion
What is a Gantt Chart and Why Use One?
The Gantt chart is a powerful visual tool that graphically represents a project’s task timeline. This bar chart layout provides a complete overview, enabling you to efficiently orchestrate each step of your projects.
Definition and Key Components
A Gantt chart is a horizontal bar chart that illustrates task planning along a timeline. It typically consists of two parts: a task list on the left and a scheduling timeline with bars on the right.
Key components include:
- Start and end dates for each task and the overall project
- All necessary tasks
- A forecast calendar indicating when each task should occur
- Task dependencies
- Progress status to visualize how each task is advancing
To create a simple Gantt chart, understand that each bar represents a specific task, and its length indicates the time allocated for completion.
 Executing a Gantt chart in Kantree
Project Management Benefits
Using a Gantt chart offers numerous benefits for project management.
First, it significantly enhances visibility. This visual method allows you to see all planned tasks and their progress at a glance. As a result, you can quickly identify if you’re behind, ahead, or on schedule using Kantree’s intuitive interface.
Second, it facilitates team communication. Each member can track their own tasks and those of others, reducing misunderstandings and improving collaboration. Kantree’s collaborative features simplify complex task data and clarify roles through real-time comments and notifications.
Kantree also enables optimal resource allocation, a fundamental aspect of effective project management. It helps determine when resources are needed, identifies their availability, and prevents bottlenecks via its built-in workload view.
Finally, it offers valuable flexibility. Since projects often evolve, the Gantt chart lets you adjust tasks and resources to unexpected changes with a simple drag-and-drop.
Common Use Cases with Kantree
Kantree’s Gantt view applies to various industries and project types:
Large-scale construction: Whether building or renovating, these projects require a structured sequence. Kantree syncs contractors, manages deliveries, and sets interim deadlines using industry-specific custom fields.
Event planning: For organizing events, Kantree coordinates venue setup, catering, marketing, and invitations up to the event date, with colored tags to distinguish activity types.
Software development: Even in agile environments, many teams still use Gantt charts for version planning. Kantree perfectly combines the agile Kanban approach with the Gantt view for optimal hybrid management.
Marketing campaigns: When launching a new product, Kantree’s Gantt chart helps visualize concept creation, content production, and advertising rollout while attaching relevant files directly to tasks.
Preparation Before Creating Your Gantt Chart
Before jumping into creating your Gantt chart, a careful preparation phase is essential. Though often overlooked, this step determines the quality and effectiveness of your planning. Let’s review the three key components of this preparation.
Identify the Main Project Tasks
The first step is to clearly define your project scope. Ask the right questions: what are your goals, timeline, available resources, and expected deliverables? This big-picture view lays the foundation for your planning.
To structure your project in Kantree, two approaches are available:
- The top-down method: first identify the major phases, then break them into individual tasks
- The bottom-up method: list all possible tasks in Kantree, then group them into phases using the flexible grouping feature
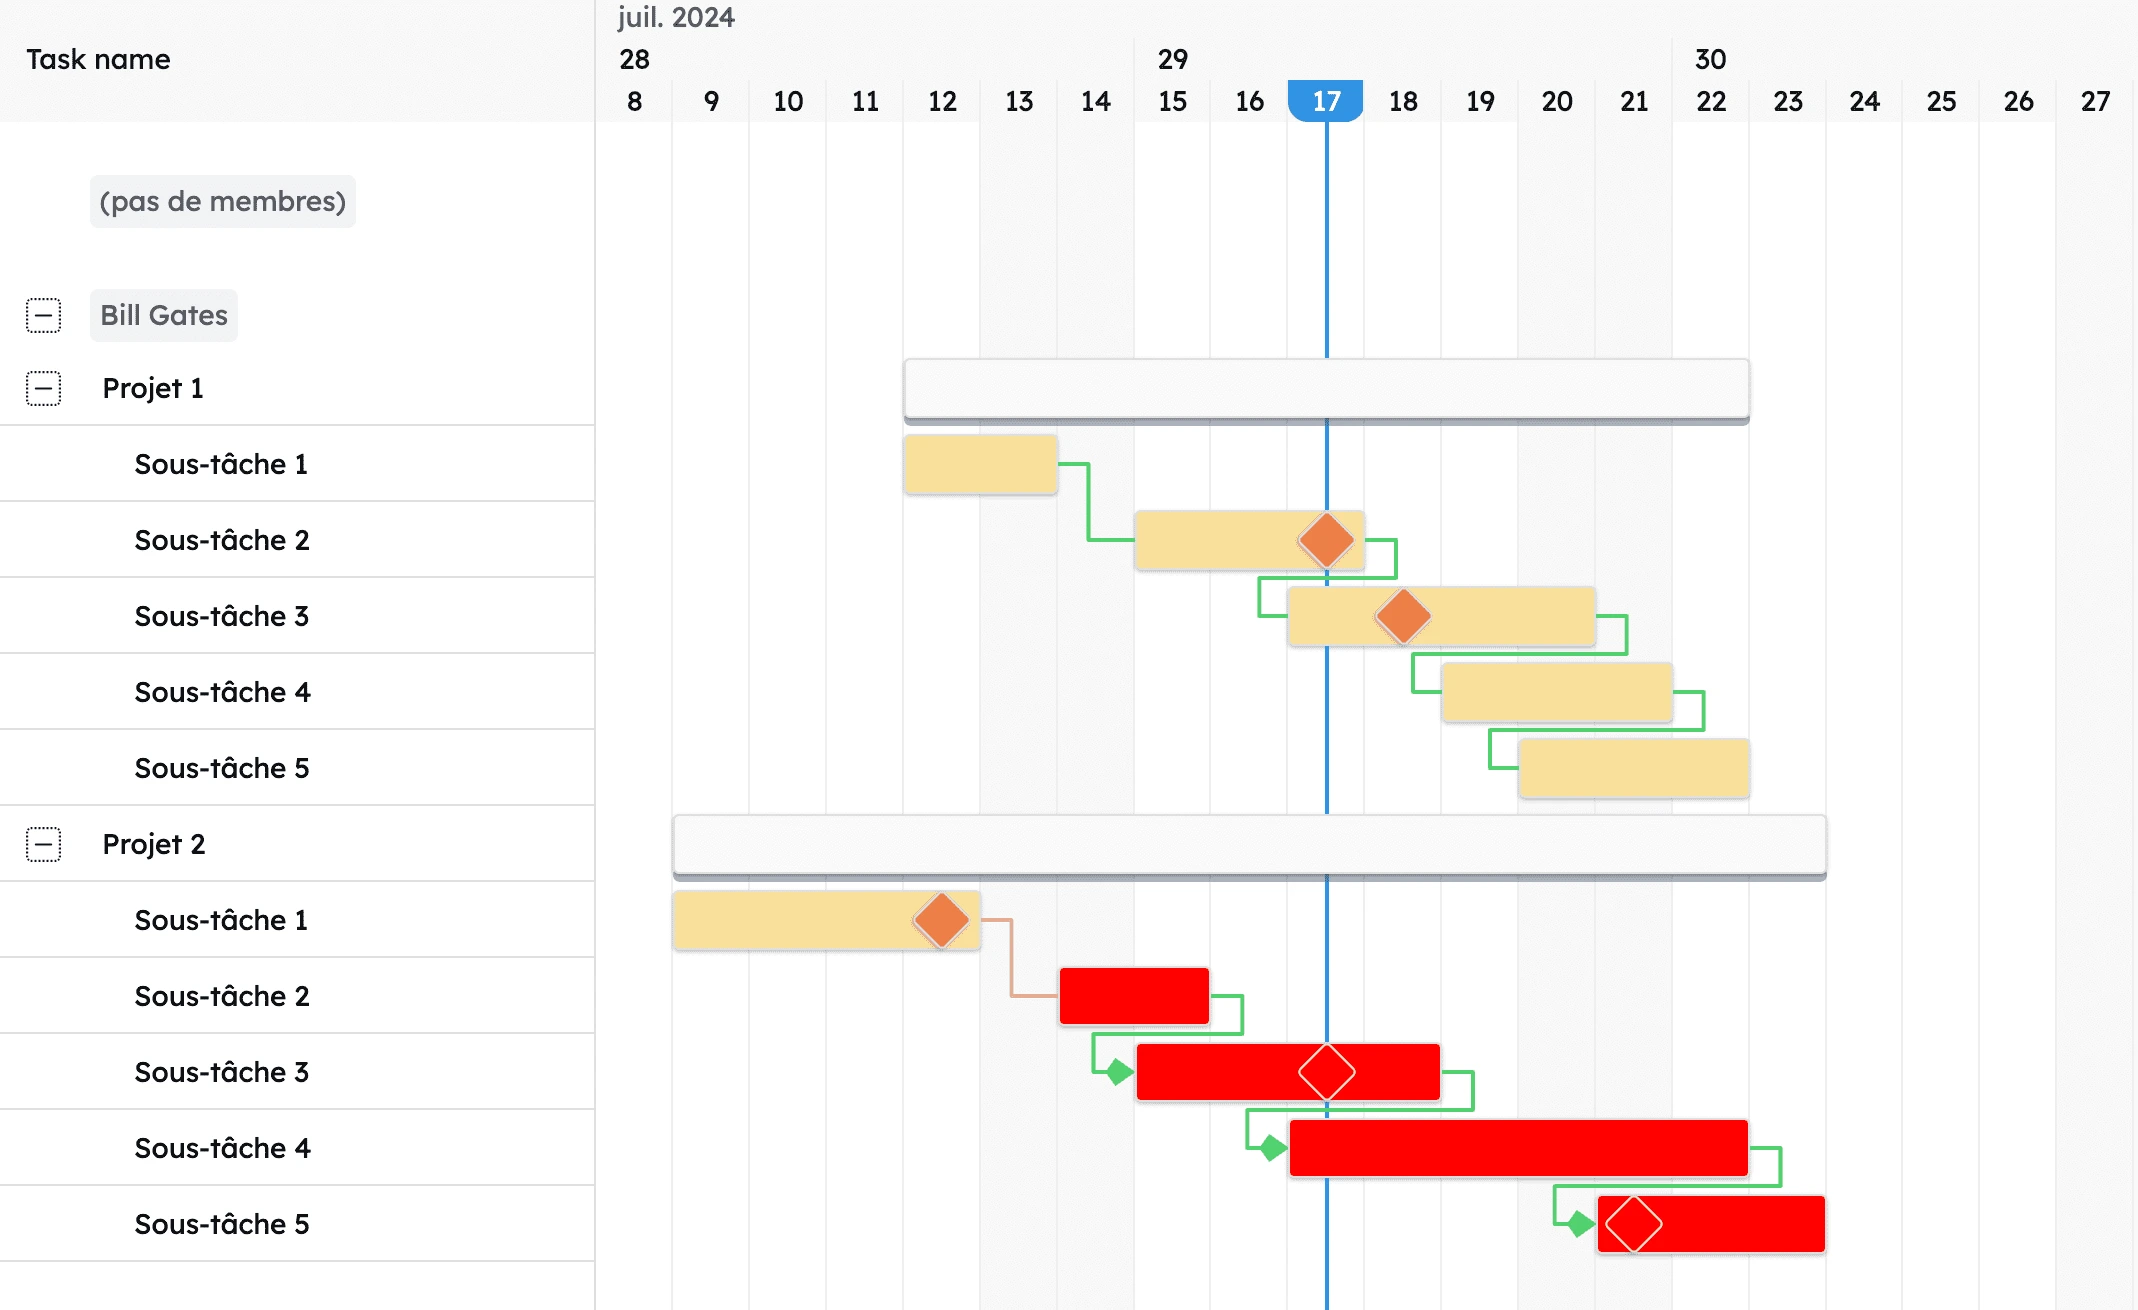 Gantt chart as displayed in Kantree
Whichever method you choose, the goal remains the same: create a comprehensive, hierarchical list of tasks to complete. For complex projects, using a Work Breakdown Structure (WBS) is especially effective.
Important: Summary and sub-tasks create structure but do not automatically create dependencies in Kantree.
Define Durations and Dependencies
Estimate the duration of each task using the appropriate unit (hours, days, weeks). Dependencies define task relationships and dictate execution order. Kantree supports four main types:
- Finish to Start (most common): a task can’t start until another ends
- Start to Start: a task starts only if the previous one has started
- Finish to Finish: both tasks must finish at the same time
- Start to Finish (rare): a task can’t finish unless another has started
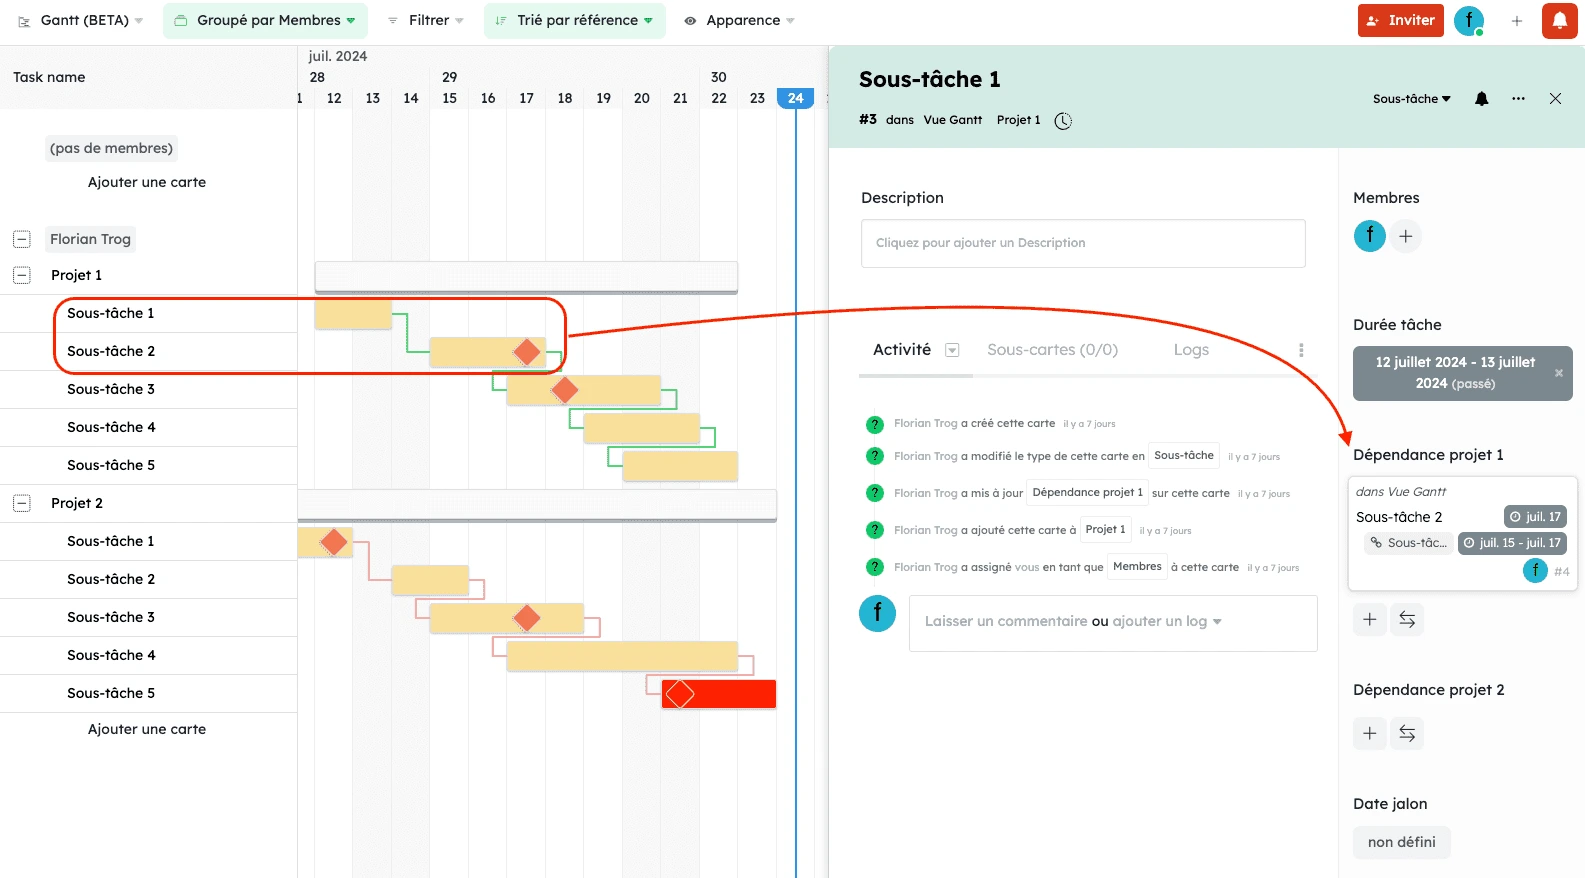 Sub-task dependencies in Kantree
Identifying these dependencies helps determine the project’s critical path — the task sequence that cannot afford delays.
Gather Resource Information
Final key step: identify and allocate resources in Kantree. These may be human, material, financial, or consumable. Proceed methodically:
- Identify required skills and materials per task using Kantree’s custom fields
- Assess resource availability with the integrated team calendar
- Assign resources to tasks via drag-and-drop
- Balance team workload using Kantree’s filtered workload view
In your Gantt chart, resources typically appear alongside task bars. This helps spot overloads or underutilization quickly.
Note: at this stage, resource assignment doesn’t need to be final or individual. The goal is to validate that your organization has the capacity to execute the project, and Kantree makes future adjustments easy.
Thorough preparation is the secret to an effective Gantt chart. By investing time in this preliminary phase with Kantree, you’ll avoid many adjustments later and greatly improve your chances of success.
Steps to Create a Simple Gantt Chart in 15 Minutes with Kantree
Creating an effective Gantt chart may seem complex, but Kantree’s methodical approach lets you do it in just 15 minutes. Follow these four essential steps to turn your task list into a clear, actionable timeline.
 Kantree centralizes everything in one place, regardless of your team
Get Familiar with Kantree’s Interface
First, get to know Kantree’s intuitive interface. Unlike other solutions that require a steep learning curve, Kantree is designed to be immediately accessible to all users, regardless of project management experience.
Key benefits of Kantree for Gantt creation include:
- A clean, well-designed UI with direct Gantt view access from the main menu
- Real-time collaboration features allowing team-wide participation
- The ability to import data from Excel or other project tools
- Pre-built templates tailored to various industries to save time
Kantree’s main strength is its cloud accessibility: all stakeholders can align with just an internet connection—no installation needed. Plus, unlike static Excel files, information is updated automatically in real time.
Create the Basic Structure in Kantree
Set up your project’s date range and adjust the time scale (days, weeks, or months) based on total project length. Kantree also allows calendar customization, such as setting non-working days.
Add Tasks and Define Durations
Now, input the tasks identified during the preparation phase. In Kantree, you can either create tasks directly in the Gantt view or import them from an existing Kanban or list view.
For each task, Kantree lets you easily enter:
- The task name with a detailed description
- Start date via a calendar picker
- Duration or end date (auto-calculated if needed)
- Custom fields like priority level, assignees, or progress rate
Each task appears as a horizontal bar whose length reflects duration, with customizable color coding.
To specify duration in Kantree, use the unit that best fits your project: hours (h), days (d), weeks (w), or months (m). For example, for a three-day task, simply type “3d” or use the duration slider.
Set Task Dependencies
Link dependent tasks using dynamic arrows that represent the execution sequence. In Kantree, just click and drag from one task to another or use the context menu.
Once dependencies are set, any change to one task will automatically impact its linked tasks, ensuring schedule consistency.
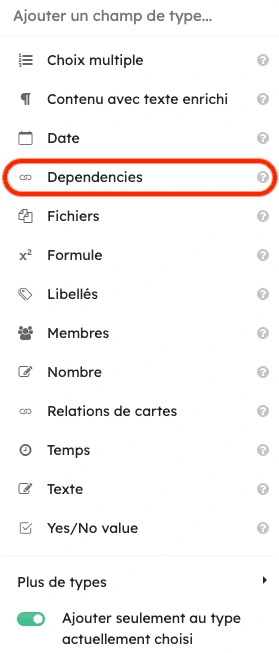 Creating dependencies in Kantree
Customization and Optimization in 10 Extra Minutes
Now that your basic chart is built, it’s time to personalize it for maximum efficiency. These next ten minutes will enhance your tool with Kantree’s advanced features, making it even more effective for your team.
Add Important Milestones
Milestones mark key project phases. With no duration, they appear as distinctive diamonds in the Gantt view. To add one, create a new “Milestone” card or convert an existing task.
Milestones add real value to your Gantt chart in Kantree:
- They help track progress against the initial plan, with automatic notifications near key dates
- They give external stakeholders a clear summary view via Kantree’s automated reports
- They help spot risks early using the built-in delay indicator
- They motivate teams by showing visible achievements on personal dashboards
Milestones are especially helpful in Kantree to mark key dates such as product launches, critical meetings, or phase completions.
Assign Resources to Tasks
For each task, identify the person and material resources needed. In Kantree, assign one or more people via the “Members” field and indicate their involvement percentage. This clarifies responsibilities and helps avoid overload.
Use Color Coding for Better Clarity
Color coding improves readability by distinguishing task types. Set a consistent logic in project settings—red for critical tasks, green for completed, yellow for in-progress.
Finalization and Sharing in 5 Minutes
Once your chart is customized, spend the final minutes finalizing and sharing it with Kantree — key steps to turning your planning into an effective collaborative tool.
Verify Chart Consistency
Review the overall consistency of your chart using Kantree’s built-in analysis tool. Check task dependencies, as a delay on the critical path will impact the project’s end date. Also ensure holidays and absences are accounted for.
Collaborative Access Options in Kantree
Share your Gantt chart in several ways:
- Internally with various permission levels
- Externally via a secure public link
Changes are visible in real time, with an intelligent notification system. The activity log tracks who viewed or edited the chart.
Conclusion
Kantree’s Gantt view turns complex project management into a structured, accessible process. Our 30-minute approach helps you master the essentials: identifying tasks, setting dependencies, allocating resources, and final customization.
The key to success lies in careful preparation and smart use of Kantree. The platform simplifies not only creation, but also sharing and real-time collaboration.
Yes, setting up a Gantt project requires some initial investment—but the efficiency gain is well worth the effort. Teams gain clarity, projects move faster, and objectives become easier to achieve.
Start applying these principles to your projects today with Kantree to significantly improve your ability to deliver results on time.
To go further
3 options are available if you're interested in this topic:
-
1
Try Kantree here, it is free and you don’t need any credit card
-
2
If you want to learn more about how Kantree can adapt to your challenges, make an appointment with an expert on your use case.
-
3
Are you willing to join +1500 professionals receiving our advices and news on digitalization, collaboration, productivity? Register to our newsletter here.
If you found this article helpful, consider sharing it. You can easily do so below.